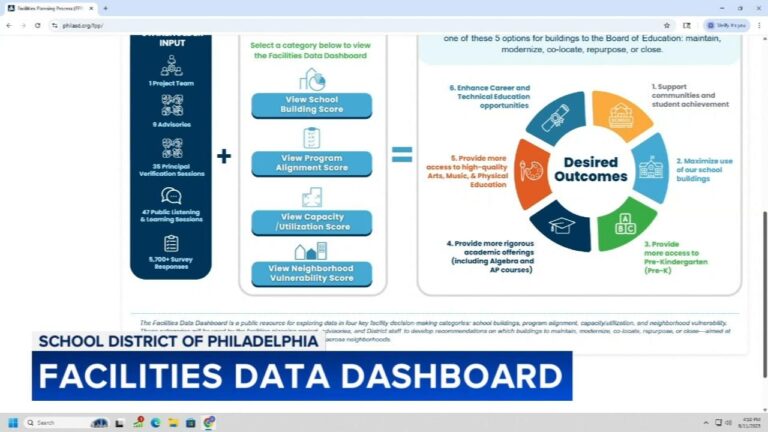
Philadelphia’s New School Facilities Dashboard: A Comprehensive Overview of Infrastructure and Maintenance
Philadelphia has introduced an innovative facilities data dashboard that provides parents, students, and educators with an in-depth view of the physical conditions of schools throughout the district. This interactive platform offers transparency by detailing maintenance activities, repair timelines, and the overall state of school infrastructure. By examining this data, stakeholders gain valuable insights into the environments where tens of thousands of students spend their days learning and growing.
The dashboard highlights a mixed picture: while many schools have made notable strides in addressing repair requests promptly and adhering to safety standards, others still face challenges such as outdated HVAC systems and aging classroom facilities. Users can access comprehensive facility ratings that evaluate cleanliness, structural soundness, and recent capital improvements, empowering communities to better understand their local schools’ needs.
Some significant statistics from the dashboard include:
- Over 60% of schools achieved above-average scores for maintenance responsiveness within the last year.
- Approximately one-quarter of school buildings urgently require upgrades to comply with modern energy efficiency guidelines.
- Funding for technology infrastructure has more than doubled compared to previous years, enhancing digital learning opportunities for students.
| Facility Component | District Average Score | Areas Requiring Improvement |
|---|---|---|
| Cleanliness | 88% | Locker rooms, Cafeterias |
| Structural Integrity | 73% | Roof repairs, Foundation cracks |
| Maintenance Response | 81% | Plumbing, HVAC systems |
| Technology Access | 90% | Network coverage, Computer labs |
Unequal Resource Distribution and Infrastructure Challenges Across Philadelphia Schools
The dashboard also sheds light on disparities in how resources are allocated among Philadelphia’s public schools. While some campuses benefit from recent investments in facility upgrades and cutting-edge technology, others continue to struggle with aging infrastructure and insufficient access to essential amenities. Key metrics such as funding per square foot, frequency of maintenance visits, and classroom occupancy rates reveal stark contrasts that affect students’ daily educational experiences.
Neighborhood-level data uncovers several notable trends:
- Affluent areas: Schools located in wealthier neighborhoods tend to receive more frequent renovations and infrastructure enhancements.
- Under-resourced zones: Schools in economically challenged communities often face deferred maintenance and overcrowded classrooms.
- Equity concerns: These patterns highlight the urgent need for targeted policies to bridge infrastructure gaps and promote fairness.
| Region | Average Annual Facilities Budget | Maintenance Visits per Year | Classroom Utilization Rate |
|---|---|---|---|
| North Philadelphia | $450,000 | 12 | 95% |
| West Philadelphia | $375,000 | 9 | 88% |
| South Philadelphia | $520,000 | 15 | 97% |
| Center City | $600,000 | 18 | 91% |
How School Facility Conditions Influence Student Outcomes and Community Vitality
Facility ratings extend beyond mere statistics; they profoundly affect students’ academic experiences and the broader community’s health. Classrooms equipped with sufficient lighting, effective ventilation, and up-to-date technology foster better concentration and engagement. Well-maintained common spaces encourage social interaction and a sense of belonging among students. Conversely, schools burdened by outdated infrastructure or frequent repair issues often struggle to provide a safe, welcoming environment, which can negatively impact attendance, motivation, and overall student morale.
Moreover, the state of school facilities reflects the level of community investment and priorities, shaping public perception and neighborhood pride. Areas with higher facility scores often experience:
- Greater parental engagement due to more inviting and accessible school environments.
- Stronger collaborations between local organizations and educational institutions.
- Enhanced student health through cleaner, safer school settings.
| Facility Element | Effect on Student Experience | Community Benefit |
|---|---|---|
| Indoor Air Quality | Decreases student absenteeism | Promotes healthier neighborhoods |
| Access to Technology | Boosts student engagement and learning | Supports equitable educational opportunities |
| Playground Safety | Encourages physical activity and well-being | Enhances family-friendly community reputation |
Strategic Recommendations to Overcome Infrastructure Challenges in Philadelphia Schools
Addressing the ongoing infrastructure issues in Philadelphia’s schools requires a focused approach that balances immediate repairs with sustainable, long-term improvements. Priorities include modernizing outdated HVAC systems, fixing roof leaks, and ensuring all facilities meet accessibility standards to foster inclusive, healthy learning spaces. Leveraging public-private partnerships alongside increased state and federal funding can provide the necessary financial support for these initiatives.
Recommended actions to drive progress:
- Consistent, transparent updates: Use the facilities dashboard to track improvements and maintain community engagement and accountability.
- Data-driven resource allocation: Focus investments on schools with the most critical needs, informed by both quantitative data and stakeholder feedback.
- Adoption of green building standards: Enhance energy efficiency to reduce costs and improve indoor environmental quality.
- Inclusive stakeholder involvement: Engage educators, families, and students early in planning to ensure diverse perspectives shape facility upgrades.
| Initiative | Expected Benefits | Implementation Timeline |
|---|---|---|
| HVAC Modernization | Better air quality, fewer student illnesses | 2024–2026 |
| Roof and Structural Repairs | Increased safety, prevention of water damage | 2024–2025 |
| Accessibility Enhancements | Inclusive environments for all learners | 2024–2027 |
| Energy Efficiency Projects | Reduced utility costs, environmental sustainability | 2025–2028 |
Conclusion: Empowering Philadelphia’s Schools Through Transparency and Targeted Investment
Greater openness regarding the condition of school facilities is essential to fostering safe, equitable educational settings for every student in Philadelphia. The district’s newly launched facilities data dashboard equips families, educators, and community members with a powerful resource to monitor school conditions and advocate for necessary improvements. As public engagement grows and stakeholders examine how their schools perform, sustained attention and strategic investment will be vital to ensuring all students learn in environments that support their success and well-being. This dashboard is more than a status report—it is a catalyst for action to uplift Philadelphia’s public schools for generations to come.


